The top news stories from Canada
Provided by AGPMcEwen Generates Strong Q1 Results & Advances Multi-Asset Growth Strategy; Net Income $33.4M ($0.56 per Share) vs. Net Loss $6.3M ($0.12 per Share) in Q1 2025; Internally Funding Key Projects to Double Production by 2030
TORONTO, May 06, 2026 (GLOBE NEWSWIRE) -- McEwen Inc. (NYSE/TSX: MUX) (“McEwen” or the “Company”) today announced its first quarter financial results for the period ended March 31, 2026 (Q1), along with an update on its development projects, including an updated Mineral Resource Estimate and strong exploration results across all sites as the Company is advancing its plan to increase production to 250,000 - 300,000 GEOs by 2030.
Based on current gold and silver prices, McEwen believes that if mine operations meet guidance, the Company can self-fund its future production growth with limited share dilution. This will be a key driver behind growing our share price.
Strong Gold Prices Continue to Support Advancement of Key Projects:
Canada
In Canada, McEwen is advancing growth projects to increase production from 16,000 - 19,000 GEOs in 2026 to 105,000 - 120,000 GEOs by 2030. The Company will be developing these projects in a phased approach that is focused on initial capital requirements, IRR and the ability to execute successfully while prioritizing future growth through continued exploration success.
-
Stock Mine (Fox Complex, Timmins, Ontario) - Development continued on time and within budget during Q1. We invested $9.9 million into Stock during Q1 and $39.4 million since the start of underground development last year. Stock is expected to begin initial production in H2 2026, with commercial production set for 2027. This is expected to result in lower-cost gold production at the Fox Complex compared to current operations, due to a lower royalty burden, shorter haulage distances to the mill, and the benefits of processing softer material. Based on the current Mineral Resource Estimate, McEwen projects a six-year life at Stock, which is expected to increase as underground drilling advances to enhance resources throughout coming years.
-
Grey Fox (Fox Complex, Timmins, Ontario) - Work is now being finalized on the Pre-Feasibility Study (“PFS”) that will be released in the coming months. The PFS will highlight the Company’s ability to materially extend mine life at the Fox Complex, while using existing infrastructure. McEwen is targeting combined annual production from Grey Fox and Stock of 75,000 - 90,000 GEOs by 2030.
-
Tartan Mine Project (Flin Flon, Manitoba) - During Q1 the Company delivered a Mineral Resource Estimate with underground Indicated Resources totalling 308,900 gold ounces (2,619,000 tonnes at 3.67 gpt Au) and Inferred Resources totalling 302,700 gold ounces (2,832,900 tonnes at 3.32 gpt Au). The Company is reviewing existing environmental licenses, planning additional metallurgical testing, beginning underground mine designs, and potential equipment purchases as part of its plan to restart production within the existing permits. McEwen expects initial annual production at Tartan to average approximately 30,000 GEOs, with the potential to expand output through future permit modifications. The Company believes doubling the throughput from 500 tonnes per day (tpd) to 1,000 tpd could see production grow to 45,000 - 55,000 GEOs per year.
USA
In Nevada, McEwen is forecasting that production will more than double from 39,000 - 43,000 GEOs in 2026 to 90,000 - 110,000 GEOs by 2030, driven by production from Lookout Mountain, Windfall and Trinity Ridge. All three deposits are located within the Gold Bar Mine Complex and management will look to leverage the current infrastructure at site.
-
Windfall, Lookout Mountain and Trinity Ridge (Gold Bar Mine Complex) - Gold Bar’s transformation into a long-life mine with increased production reached another milestone with the publication of the Windfall Mineral Resource Estimate. Windfall shows open-pit Indicated Resources of 227,500 gold ounces (9,402,800 tonnes at 0.75 gpt Au) and Inferred Resources of 127,800 gold ounces (2,596,400 tonnes at 1.53 gpt Au). Currently, 100% of the Mineral Resource Estimate is oxide gold mineralization that could potentially be processed using the same heap leaching methods being used at the Gold Bar Mine.
The global Resources and Reserves for the Gold Bar Mine Complex are the combined Mineral Resources and Reserves for Gold Bar Mine, Lookout Mountain and Windfall, which now total Indicated Resources of 792,000 gold ounces (38,602,800 tonnes @ 0.64 gpt Au) and Inferred Resources of 281,000 gold ounces (11,256,200 tonnes @ 0.78 gpt Au). This is in addition to Probable Reserves of 168,000 gold ounces (8,624,000 tonnes at 0.61 gpt Au).
Trinity Ridge is the next deposit where a Mineral Resource Estimate is set to be published within the Gold Bar Mine Complex and will look at merging the smaller existing Gold Bar Mine open pits into one enlarged pit that will capture a meaningful amount of gold mineralization that has not been included in the current Mineral Resource Estimate. Currently, 60% of the planned drilling at Trinity Ridge has been completed and a Mineral Resource update is expected by early 2027.
-
McEwen has completed its acquisition of Golden Lake Resources Inc. Golden Lake’s Jewel Ridge and Jewel Ridge West projects adjoin McEwen’s Windfall deposit to the north and have encouraging historical drill results, which highlight the potential to further grow our resources at the Gold Bar Mine Complex and to increase mine life.
Mexico
In Mexico, McEwen is forecasting 20,000 GEOs production per year starting mid-2027.
-
El Gallo - The Company continues to target Phase 1 production starting mid-2027. Detailed engineering is well advanced, with construction of the mill expected to begin in early Q3. Phase 1 is expected to operate for at least 10 years, producing approximately 20,000 GEOs annually once commercial production is achieved. The Company is exploring opportunities within its land package that would require minimal capital to see the life of Phase 1 extended. Permit approval for Phase 2 (El Gallo Silver) would materially extend the mine life and increase production to approximately 40,000 - 50,000 GEOs (based on 77:1 silver to gold ratio) due to higher grades being processed. The Company is currently updating the Mineral Resource Estimate to include all resources around the proposed mill site, which will be released in Q3.
Argentina
-
San José Mine - The operation is benefiting from the recently completed process plant expansion and higher mining rates, resulting in increased production and lower costs. At current gold and silver prices, San José is expected to be an important source of capital that the Company will use to expand production at its other sites. Production attributable to McEwen’s 49% interest is targeted at 60,000 - 70,000 GEOs per year (based on a 77:1 silver-to-gold ratio). The Company anticipates receiving $40 - $50M from San José in 2026.
-
McEwen Copper
McEwen owns a 46.3% equity stake in McEwen Copper and a 1.25% NSR royalty on McEwen Copper’s Los Azules copper project. The royalty is projected to generate pre-tax $520.5 million at recent copper spot price of $5.80/lb and $389.5 million at the feasibility study's base-case copper price of $4.35/lb over the 22-year mine life. There is potential to extend the life of Los Azules by an additional 33 years.
Los Azules advanced significantly in 2025, completing two foundational milestones: approval of its application under Argentina’s RIGI (Large Investment Incentive Regime), securing 30 years of legal, fiscal, and customs stability; and publication of a Feasibility Study confirming robust project economics, with initial 5-year average production of 205 ktpa of copper cathodes at $1.71/lb C1 cash cost over a 22-year mine life and identified upside potential to extend mine life for an additional 33 years adding an average of 141ktpa Cu per annum.
Following the Feasibility Study, project costs began to be capitalized in late Q3 2025 under U.S. GAAP. The 2026 objective is to advance the project toward a Final Investment Decision targeted for year-end 2026, with construction targeted to commence in early 2027, and production in 2030, subject to project financing and customary approvals.
Highlights of Q1 2026
Abbreviations used are defined in the Glossary at the end of this press release.
| Revenue | Q1 2026 revenue increased by 107% to $74.0M from the sale of 15,752 GEOs, vs revenue of $35.7M from the sale of 13,036 GEOs in Q1 2025. The average realized gold sale price per GEO was $4,792 in Q1, 71% higher than $2,803 in Q1 2025. Our 49% ownership in the San José mine is excluded from our revenue numbers due to accounting policies under U.S. GAAP. | |
| Profitability | Q1 2026 gross profit was $31.5M, compared with $10.1M in Q1 2025. Gross margins were positively impacted by increased production and higher gold prices. Q1 2026 net income was $33.4M or $0.56 per share, compared with a net loss of $6.3M or $0.12 per share in Q1 2025. | |
| Adjusted EBITDA |
Q1 2026 adjusted EBITDA increased to $44.8M or $0.76 per share, compared with $8.7M or $0.16 per share in Q1 2025. Adjusted EBITDA is calculated by adding back our portion of McEwen Copper's results to our consolidated income or loss before financing costs, depreciation, and income and mining taxes. We use adjusted EBITDA to evaluate our operating performance and ability to generate cash flow from our gold operations in production, including the San José Mine. |
|
|
Liquidity & Capital Resources at March 31, 2026 |
Cash and equivalents increased to $56.5M, compared with $51.0M at December 31, 2025. The value of marketable securities decreased to $13.5M, compared with $21.1M at December 31, 2025. The main reason for the decrease is due to McEwen having acquired 100% of Canadian Gold Corp., which had a market value of $5.6M at December 31, 2025. On December 9, 2025, the Company acquired a 27.3% interest in Paragon Advanced Labs, at a cost basis of $13.7M. As of March 31, 2026, the fair value of the investment was $20.4M. As of March 31, 2026, McEwen has loaned $13.6M to McEwen Copper. The most recent financing of McEwen Copper at $30 per share on October 24, 2024 implies a full market value of $987.5M. Based on this valuation, McEwen’s 46.3% ownership of McEwen Copper has an implied market value of $457M or $7.65 per MUX share (based on McEwen’s shares outstanding as of the date of this press release). Since that financing, the project has seen significant development and derisking with the RIGI approval, the completion of the feasibility study, and is now preparing for a Final Investment Decision. Debt principal outstanding remained unchanged at $130.0M ($110.0M in convertible notes due 2030 and $20.0M under our term loan facility). The reported total debt of $126.4M reflects the debt principal of $130.0M, less debt issuance costs of $3.6M, which are amortized over the life of the debt, in accordance with U.S. GAAP. McEwen had 59.2M shares outstanding on March 31, 2026, compared with 55.5M shares on December 31, 2025, mainly due to the shares issued in connection with the acquisition of Canadian Gold Corp. |
|
|
San José Mine Performance |
14,582 GEOs were produced in Q1 and were 33% higher than in Q1 2025. Strong production continued from Q4 2025 and was the result of increased plant capacity and mining rates. Given the strong production in Q1, production costs per GEO sold were $2,365 for cash costs and $2,704 for AISC, a decrease of 8% and 11%, respectively, compared with Q1 2025. In February, McEwen received an $8.8 M dividend from the San José Mine. Gowing forward, San José intends to pay out 90% of the mine’s cash flow to the partners. At March 31, 2026, the San José Mine held a cash balance of $217.1M versus $151.8M on December 31, 2025, on a 100% basis. At current gold and silver prices, the Company anticipates receiving $40-$50M in dividend payments from San José in 2026. |
|
| Gold Bar Performance |
7,884 GEOs were produced from the Gold Bar Complex in Q1. Costs were higher than Q1 2025 due to 1) lower mined grades, and 2) increased mining of non-mineralized material. Both factors were anticipated and incorporated into our 2026 planning, and Gold Bar is on track to meet 2026 production and cost guidance. Costs per GEO sold in Q1 were $2,460 for cash costs and $2,705 for AISC. |
|
| Fox Complex Performance | 5,784 GEOs were produced in Q1. Costs per GEO sold in Q1 were $2,365 for cash costs and $3,148 for AISC. AISC costs were higher compared to prior quarters due to development work completed on the lower levels of Froome West to create access to new mining areas later in the year. This accounted for $778 of the AISC per ounce during the quarter. These costs are expected to trend down through 2026 as required development is completed. | |
| Exploration & Development |
$5.5M was invested during Q1 in exploration, compared with $3.7M in Q1 2025. For the full year, the Company is planning to invest $22.2M across its portfolio. Recent exploration highlights are detailed in their respective sections in this news release. $16.5M was invested by McEwen Copper in the Los Azules copper project in Q1, representing our 46.3% share of costs to advance detailed engineering in preparation of a final investment decision, compared with $18.5M in Q1 2025. As a Mineral Reserve statement with an effective date of September 3, 2025 was published, eligible development costs are now capitalized and will no longer be included in McEwen’s income statement under U.S. GAAP. |
|
| Health & Safety |
On April 3, a contractor working for McEwen Copper at the Los Azules project in Argentina died during road construction when their bulldozer overturned. A full investigation at Los Azules is underway. A second fatality occurred on April 6, at the Gold Bar Mine, where a contractor passed away due to natural causes. The Company is deeply saddened by these events and extends sincere condolences to the families, friends and colleagues affected by these losses. |
|
| 2026 Production & Unit Costs Outlook |
Full-year 2026 production guidance remains between 114,000 - 126,000 GEOs, including our attributable production from our 49%-owned San José mine and assuming a 77:1 silver-to-gold ratio. Our production guidance does not include early pre-commercial production from the Stock mine. Cost per ounce guidance range remains unchanged, at $2,100 to $2,300 for cash costs, and $2,400 to $2,600 for AISC. |
|
Mineral Resource & Exploration Update
Gold Bar Mine Complex, Nevada (100% owned)
Update to Mineral Resource Estimate at Gold Bar
The Company is advancing three key areas at its Gold Bar Mine Complex to increase resources, extend mine life and boost annual production: 1) Lookout Mountain, 2) Windfall, and 3) Trinity Ridge, which envisions merging and enlarging several of the current open pits to access gold mineralization outside the current mine plan. McEwen believes that integrating these areas has the potential to transform the Gold Bar Mine Complex into a long-life asset. The Company released a Mineral Resource Estimate for Lookout Mountain with the 2025 year-end financial statements and is now pleased to release a Mineral Resource Estimate for the Windfall deposit located approximately 3 miles (5 km) NE of Lookout Mountain. The Windfall MRE is shown below:
Table 1. Windfall Mineral Resource Estimate - Open Pit Au Cut-off Grade: 0.005 oz/ton oxide
|
Classification |
Quantity ('000 tonnes) |
Gold Grade (gpt) |
Contained Gold (oz) |
| Gold Bar Mine Complex: Windfall | |||
| Indicated | 9,402.8 | 0.75 | 227,500 |
| Inferred | 2,596.4 | 1.53 | 127,800 |
Notes to Table 1:
- Effective date of the Mineral Resource estimate is 11 February 2026. The QP for the estimate is Mr. Michael Baumann SME-RM, CPG, an employee of McEwen Inc.
- Mineral Resources that are not Mineral Reserves do not have demonstrated economic viability.
- Resources are potentially amenable to open pit mining methods and demonstrate Reasonable Prospects for Eventual Economic Extraction (RPEEE) using an optimized resource pit shell above an economic cut-off grade of 0.005 oz/ton gold for oxidized material. Cut-off grades are based on the following costs and parameters: mining costs of U$3.89/ton (mineralized) and U$2.81/ton (waste), heap leach process cost of U$4.93/ton, NSR royalty of 5%, metallurgical recoveries of 78% (oxide), and a gold price of US$3,000/oz.
- Figures may not sum due to rounding.
Table 2. Gold Bar Mine Complex Mineral Resource and Reserve Estimates Updated
| Reserves | Resources | ||||||||
| Probable | Indicated | Inferred | |||||||
|
Quantity (‘000 tonnes) |
Gold Grade (gpt) |
Contained Gold (oz) |
Quantity (‘000 tonnes) |
Gold Grade (gpt) |
Contained Gold (oz) |
Quantity (‘000 tonnes) |
Gold Grade (gpt) |
Contained Gold (oz) |
|
| Gold Bar Mine | 8,624 | 0.61 | 168,000 | 9,630 | 0.52 | 162,200 | 1,368 | 0.43 | 19,000 |
| Lookout Mountain | - | - | - | 19,570 | 0.64 | 402,300 | 7,292 | 0.57 | 134,200 |
|
Windfall |
- | - | - | 9,403 | 0.75 | 227,500 | 2,596 | 1.53 | 127,800 |
|
Total |
8,624 | 0.61 | 168,000 | 38,603 | 0.64 | 792,000 | 11,256 | 0.78 | 281,000 |
Note to Table 2: Reserves are as of December 31, 2025; Gold Bar and Lookout Resources are as of December 31, 2025; Windfall Resource as of February 11, 2026.
A Mineral Resource Estimate for Trinity Ridge will be completed separately and released early 2027. Notably, Trinity Ridge lies within the current Plan of Operations for mining activities at the Gold Bar Mine Complex and Windfall is located on private land, which should allow for an accelerated permitting process.
Exploration at Gold Bar
Over the past nine months, drilling at the northern end of the Windfall deposit has been returning good gold grades over long widths. The results highlighted below were received after the effective cut-off date for the Windfall Mineral Resource Estimate. It is also important to note that the results from Windfall continue to show oxide mineralization that could potentially be processed using the same heap leaching technology currently used at the Gold Bar Mine, with McEwen looking to utilize the existing mine infrastructure where possible. Our focus is on return on capital and how efficiently these new ounces can be developed and produced.
Windfall (Fig. 1 and Fig. 2) (RCW = Reverse Circulation Width)
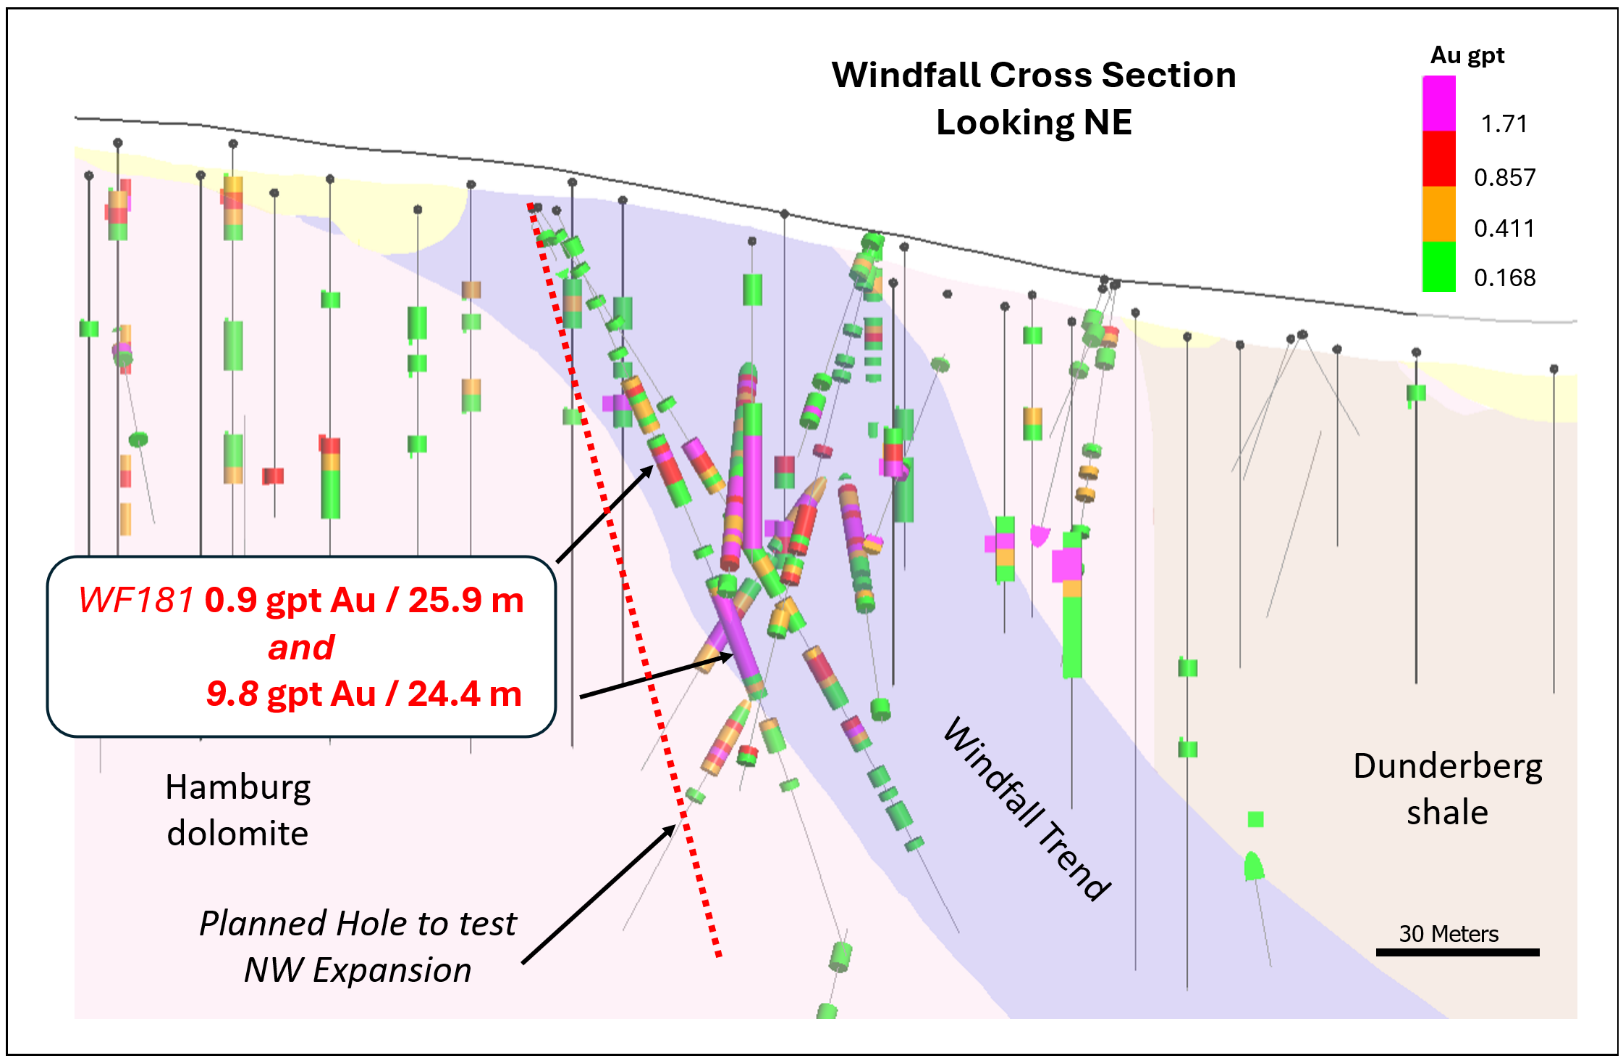
- 9.8 gpt gold over 24.4 meters (RCW) in drillhole WF181
-
0.9 gpt gold over 25.9 meters (RCW) in drillhole WF181
(Both intercepts show the zone is open to the northwest)
Fig. 1. Plan View of Recent Windfall Drilling
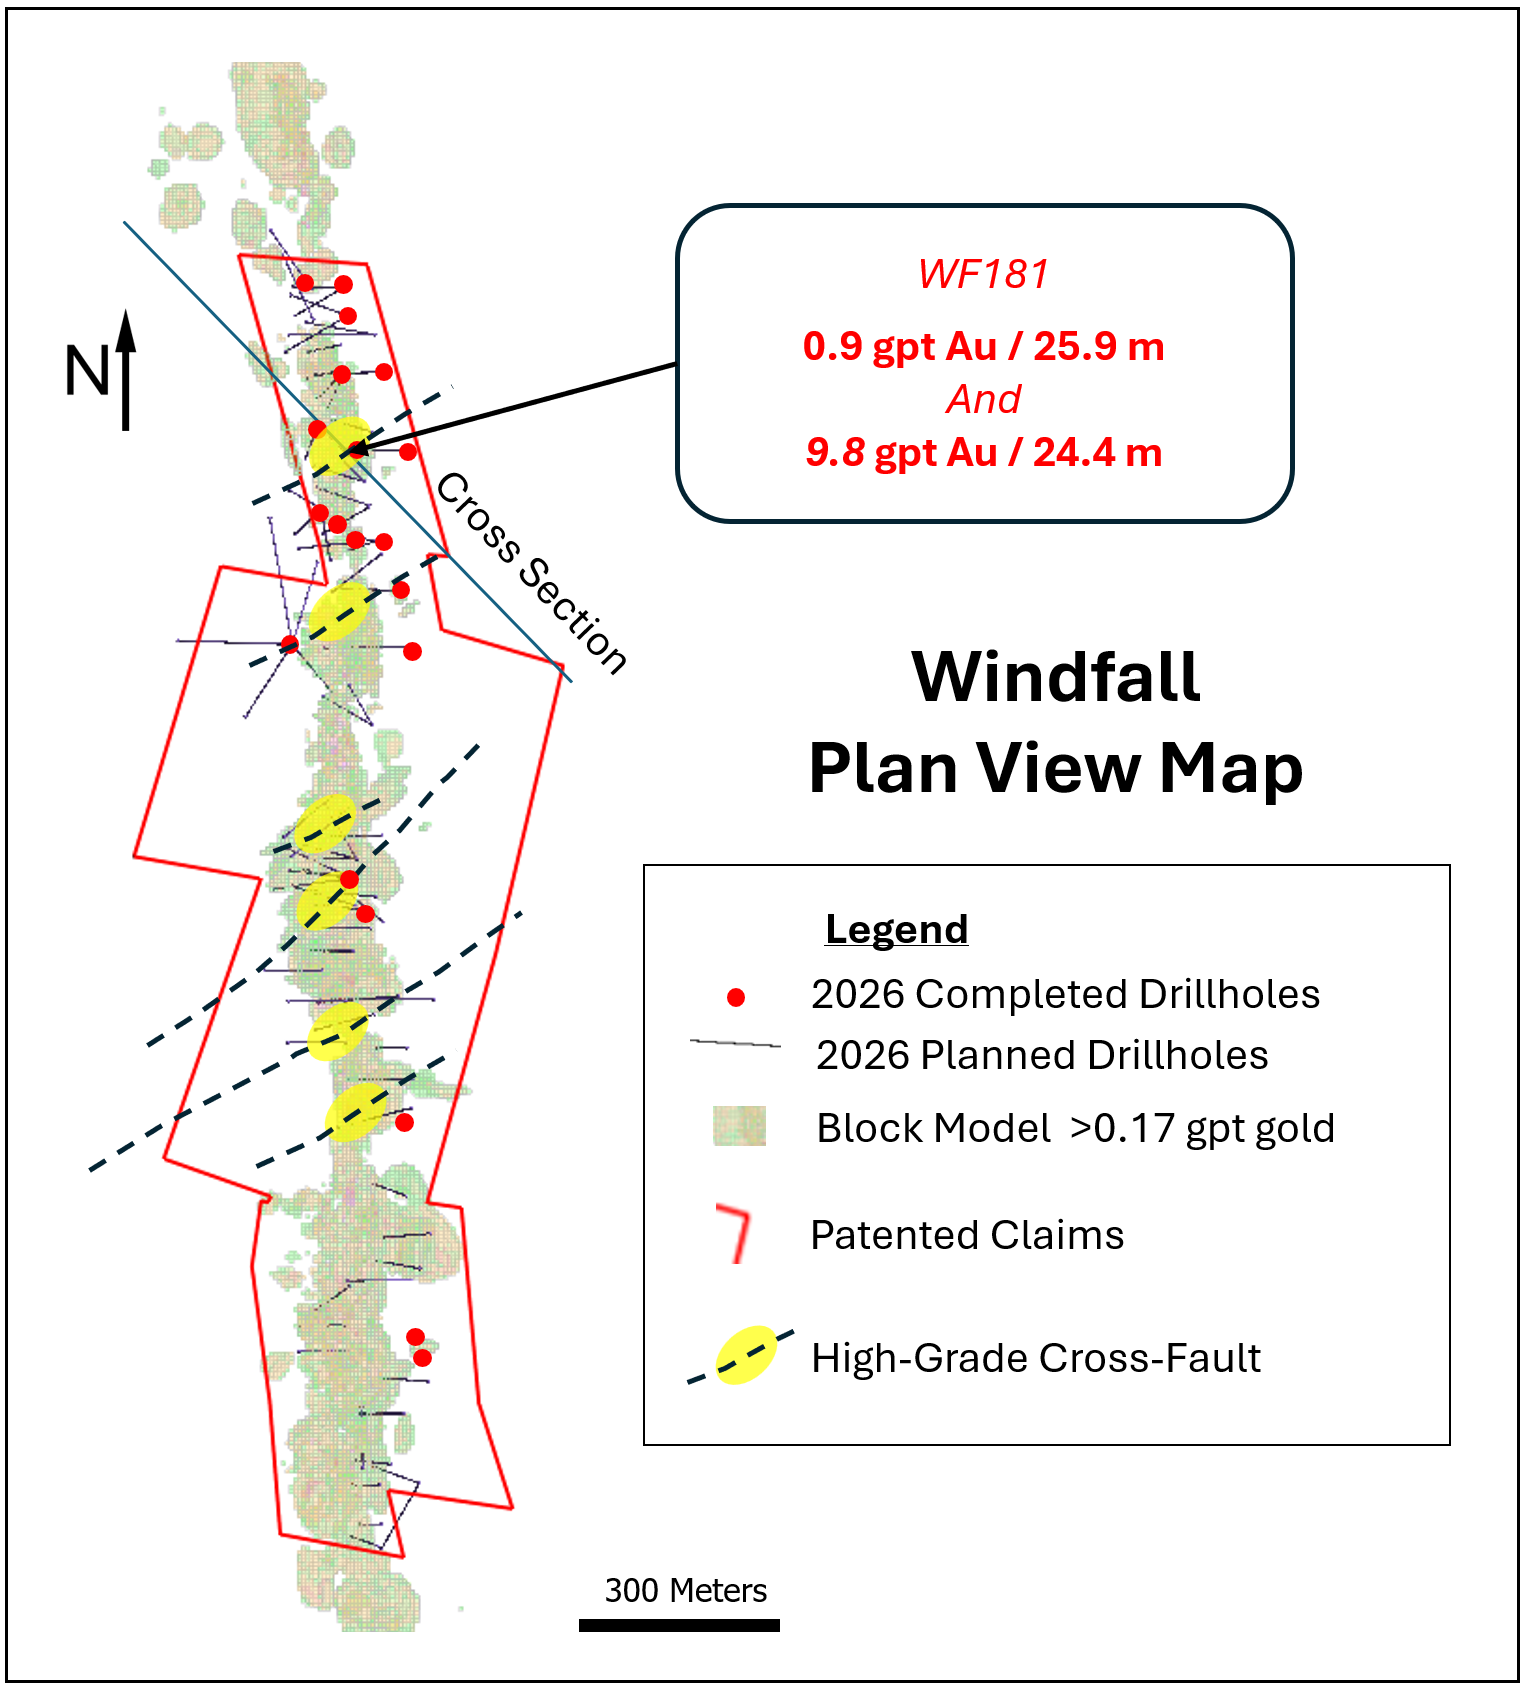
Fig. 2. Windfall Cross Section High-grade Results in Drillhole WF181
Trinity Ridge
At Trinity Ridge, located within the current limits of Gold Bar Mine, the Company is at the early stages of evaluating the potential to expand and merge three existing open pits into one larger pit.
Recent drill results continue to support the Company’s development plans for the area, with highlights shown below:
- 1.2 gpt gold over 18.3 meters (RCW) in drillhole PK 105
- 1.1 gpt gold over 15.2 meters (RCW) in drillhole PK 107
- 1.0 gpt gold over 35.1 meters (RCW) in drillhole PK 110
- 1.9 gpt gold over 41.1 meters (RCW) in drillhole PK 115
-
1.7 gpt gold over 21.3 meters (RCW) in drillhole RG053
Fox Complex Mine, Ontario (100% owned)
Exploration at Grey Fox (Fig. 3, Fig. 4 and Fig. 5)
Early in 2026, drilling at Grey Fox focused on the Gibson and Whiskey Jack Zones, where the team at McEwen believes mining can be accelerated due to their location near existing underground infrastructure.
These new drill results support additional resource growth beyond the pending PFS:
-
6.1 gpt gold over 7.3 meters (TW) in drillhole 25GF-1675
(Infill hole that has demonstrated good continuity with higher grades)
-
5.3 gpt gold over 7.3 meters (TW) in drillhole 25GF-1611
(Expansion zone hole located 135 meters north of the Gibson Zone)
-
254.2 gpt gold over 0.8 meters (TW) in drillhole 25GF-1655
(Located 180 meters from existing Gibson Ramp infrastructure and remains open for expansion)
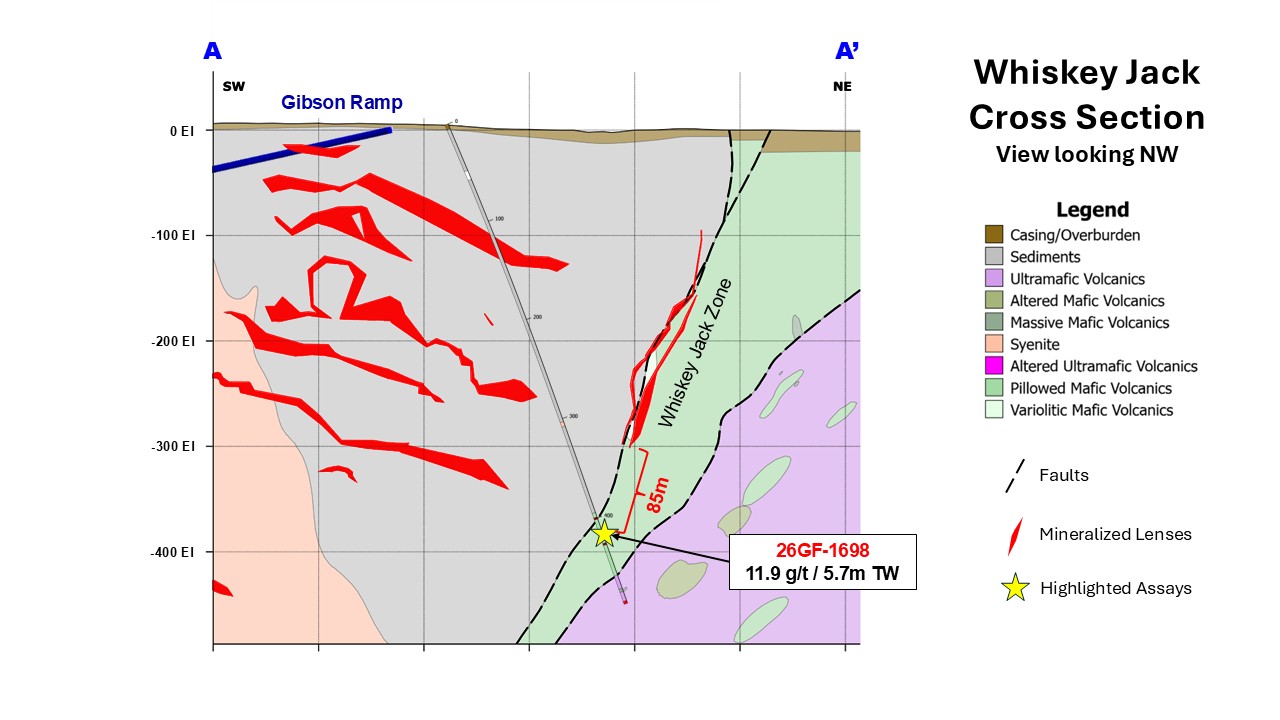
-
11.9 gpt gold over 5.7 meters (TW) in drillhole 26GF-1698
(Expanded the zone by 85 meters vertically or by 30% and remains open for expansion)
Fig. 3. Gibson and Whiskey Jack Plan View Map
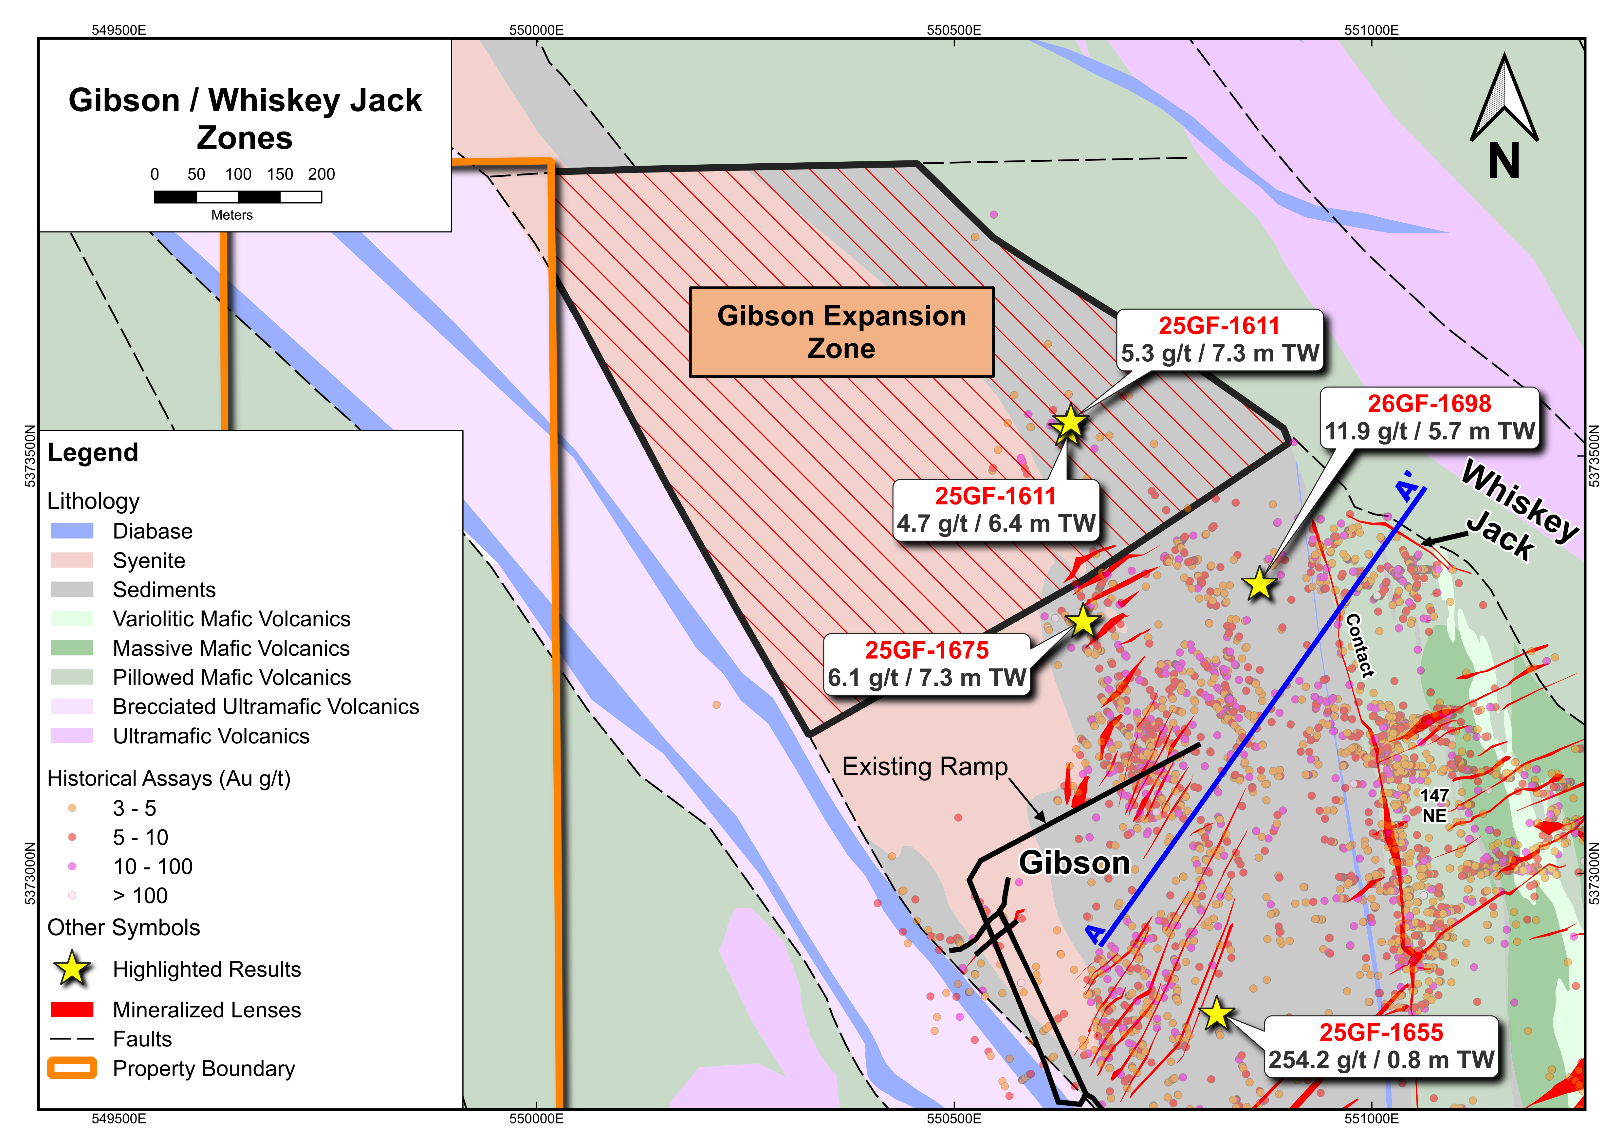
Fig. 4. Whiskey Jack Cross Section
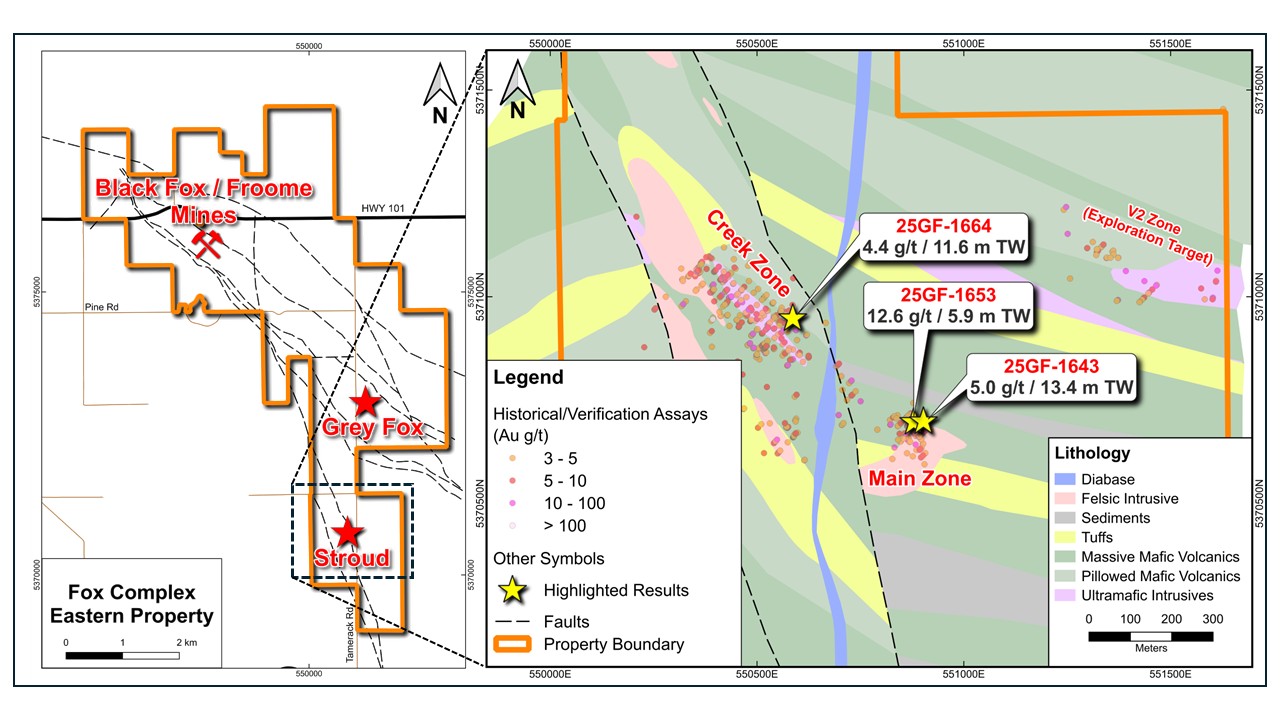
In 2025, McEwen also completed a 6,500-meter drill program at the Stroud deposit that was acquired in 2024. Stroud is located 1,500-meters southwest of the current Grey Fox Mineral Resource area (Fig. 5). The drill program was designed to confirm the historical drilling in order to update the Mineral Resource Estimate, which is set to be released with the Grey Fox PFS.
Drill highlights are shown below:
- 12.6 gpt gold over 5.9 meters TW in drillhole 25GF-1653
- 5.0 gpt gold over 13.4 meters TW in drillhole 25GF-1643
-
4.4 gpt gold over 11.6 meters TW in drillhole 25GF-1664
Fig. 5. Stroud Location and Plan View Map
Tartan Mine Project, Manitoba (100% Owned)
Exploration at Tartan (Fig. 6)
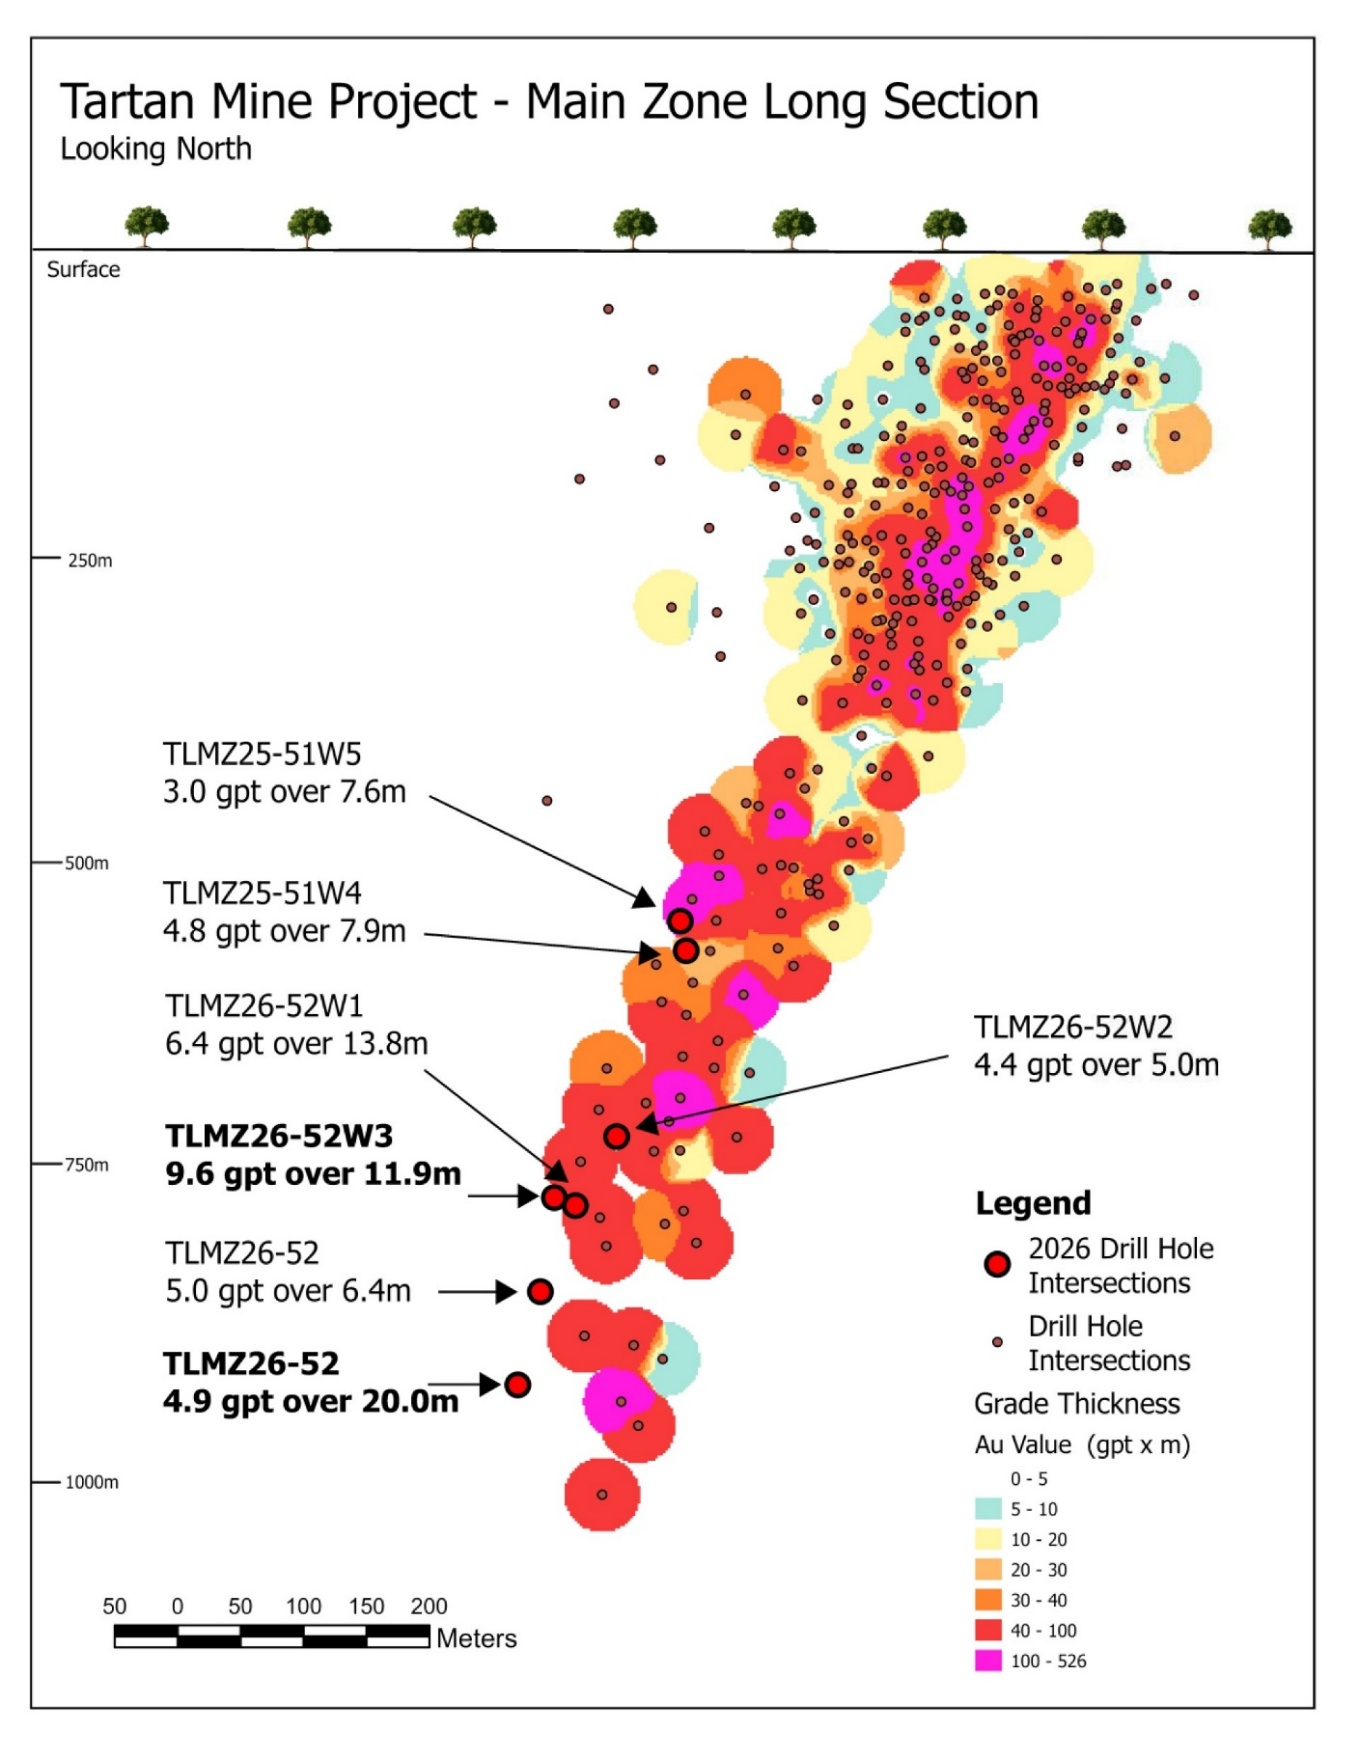
On March 23, 2026, the Company released a Mineral Resource Estimate for the Tartan Mine Project that will serve as the foundation for a potential restart of the mine. The underground Mineral Resource Estimate outlined 308,900 gold ounces Indicated (2,619,000 tonnes @ 3.67 gpt gold) and 302,700 gold ounces Inferred (2,832,900 tonnes @ 3.32 gpt gold) with the mineralization open for expansion. New drill results that have been received after the effective cut-off date for the Mineral Resource Estimate highlight further growth potential and are shown below (Fig. 6):
Tartan Potential at Depth (CW = Core Widths)
-
4.9 gpt gold over 20.0 meters (CW) in drillhole TLMZ26-52
(The fourth deepest hole at Tartan intersected the West Zone (Footwall to the Main Zone) and expanded the mineralization approximately 80 meters to the west)
Expansion Along Western Flank
- 9.6 gpt gold over 11.9 meters (CW) in drillhole TLMZ26-52W3
- 6.4 gpt gold over 13.8 meters (CW) in drillhole TLMZ26-52W1
- 5.0 gpt gold over 6.4 meters (CW) in drillhole TLMZ26-52
- 4.8 gpt gold over 7.9 meters (CW) in drillhole TLMZ25-51W4
- 4.4 gpt gold over 5.0 meters (CW) in drillhole TLMZ26-52W2
-
3.0 gpt gold over 7.6 meters (CW) in drillhole TLMZ25-51W5
(Expanded the mineralization up to 40 metres west from 500 to 800 meters below surface)
Fig. 6. Long Section of Tartan’s Main Zone – Selected Drill Highlights
For additional information, a table showing all drill results and locations from our exploration programs at Gold Bar, Fox and Tartan is available on the Company’s website and can be accessed by clicking here.
Management Conference Call
Management will discuss our Q1 2026 financial results and project developments and follow with a question-and-answer session. Questions can be asked directly by participants over the phone during the webcast.
|
Thursday, May 7, 2026 at 11:00 AM EDT |
Toll Free North America: | (888) 210-3454 |
| Toll Dial-In: | (646) 960-0130 | |
| International Dial-In: | https://events.q4irportal.com/custom/access/2324/ | |
| Conference ID Number: | 3232920 | |
| Webcast Link: | https://events.q4inc.com/attendee/512075068/guest |
An archived replay of the webcast will be available approximately two hours after the conclusion of the live event. Access the replay on the Company’s media page at https://www.mcewenmining.com/media.
Table 3. Q1 2026 Production and Costs1, Comparatives from Q1 2025 and 2026 Annual Guidance
| Q1 |
Full Year 2026 Guidance |
||||
| 2026 |
2025 |
||||
| Consolidated Production | |||||
| GEOs(2) (3) | 30,471 | 24,132 | 114,000 – 126,000 | ||
| Gold Bar Mine Complex, Nevada | |||||
| GEOs | 7,884 | 7,688 | 39,000 – 43,000 | ||
| Cash Costs/GEO | $2,460 | $1,146 | $2,250 – $2,450 | ||
| AISC/GEO | $2,705 | $2,197 | $2,350 – $2,550 | ||
| Fox Complex, Canada | |||||
| GEOs | 5,784 | 5,520 | 16,000 – 19,000 | ||
| Cash Costs/GEO | $2,365 | $2,061 | $2,200 – $2,400 | ||
| AISC/GEO | $3,148 | $2,504 | $2,650 –$2,850 | ||
| San José Mine, Argentina (49%)(4) | |||||
| GEOs | 14,582 | 10,924 | 59,000 – 64,000 | ||
| Cash Costs/GEO | $2,365 | $2,575 | $2,000 – $2,200 | ||
| AISC/GEO | $2,704 | $3,047 | $2,300 – $2,500 | ||
Notes to Table 3:
- Cash gross profit, cash costs per ounce, and all-in sustaining costs (AISC) per ounce, adjusted earnings before interest, taxes, depreciation, and amortization (adjusted EBITDA) and adjusted EBITDA per share are non-GAAP financial performance measures with no standardized definition under U.S. GAAP. For definitions of these non-GAAP measures, refer to the “Non-GAAP Financial Measures” section in this press release. For reconciliations to the closest U.S. GAAP measures, see the Management Discussion and Analysis for the quarter ended March 31, 2026, filed on EDGAR and SEDAR Plus.
- Gold Equivalent Ounces (GEOs) are calculated using gold-to-silver price ratio of 58:1 for Q1 2026 and 90:1 for Q1 2025. 2026 production guidance is calculated based on 77:1 gold to silver price ratio.
- El Gallo contributed 2,220 GEOs of production in Q1 2026.
- San José Mine figures represent the portion attributable to McEwen from its 49% interest in the San José Mine.
Glossary of Terms and Abbreviations
|
Au AISC B CW ft FS GEO gpt H1 H2 m M |
– gold – all-in sustaining costs – billion – core width – foot – feasibility study – gold equivalent ounce – grams per tonne – first half of the year (Jan 1 - June 30) – second half of the year (Jul 1 - Dec 31) – meter – million |
oz PFS Q1 RCW Q2 Q3 Q4 t tpd tpa TW |
– troy ounce – pre-feasibility study – first quarter (Jan 1 - Mar 31) – If not followed by a specific year, it references Q1 2026 – reverse circulation width – second quarter (Apr 1 - June 30) – third quarter (Jul 1 - Sep 30) – fourth quarter (Oct 1 - Dec 31) – tonne – tonnes per day – tonnes per annum – true width |
CAUTIONARY NOTE REGARDING NON-GAAP MEASURES
We have included in this report certain non-GAAP performance measures as detailed below. In the gold mining industry, these are common performance measures but do not have any standardized meaning and are considered non-GAAP measures. We use these measures to evaluate our business on an ongoing basis and believe that, in addition to conventional measures prepared in accordance with GAAP, certain investors use such non-GAAP measures to evaluate our performance and ability to generate cash flow. We also report these measures to provide investors and analysts with useful information about our underlying costs of operations and clarity over our ability to finance operations. Accordingly, they are intended to provide additional information and should not be considered in isolation or as a substitute for measures of performance prepared in accordance with GAAP. There are limitations associated with the use of such non-GAAP measures. We compensate for these limitations by relying primarily on our U.S. GAAP results and using the non-GAAP measures supplementally.
The non-GAAP measures are presented for our wholly owned mines and our interest in the San José mine. The amounts in the reconciliation tables labeled “49% basis” were derived by applying to each financial statement line item the ownership percentage interest used to arrive at our share of net income or loss during the period when applying the equity method of accounting. We do not control the interest in or operations of MSC and the presentations of assets and liabilities and revenues and expenses of MSC do not represent our legal claim to such items. The amount of cash we receive is based upon specific provisions of the Option and Joint Venture Agreement (“OJVA”) and varies depending on factors including the profitability of the operations.
The presentation of these measures, including the minority interest in the San José, has limitations as an analytical tool. Some of these limitations include:
- The amounts shown on the individual line items were derived by applying our overall economic ownership interest percentage determined when applying the equity method of accounting and do not represent our legal claim to the assets and liabilities, or the revenues and expenses; and
- Other companies in our industry may calculate their cash costs, cash cost per ounce, all-in sustaining costs, all-in sustaining costs per ounce, adjusted EBITDA, and average realized price per ounce differently than we do, limiting the usefulness as a comparative measure.
Cash Costs and All-In Sustaining Costs
The terms cash costs, cash cost per ounce, all-in sustaining costs (“AISC”), and all-in sustaining cost per ounce used in this report are non-GAAP financial measures. We report these measures to provide additional information regarding operational efficiencies on an individual mine basis, and believe these measures provide investors and analysts with useful information about our underlying costs of operations.
Cash costs consist of mining, processing, on-site general and administrative expenses, community and permitting costs related to current operations, royalty costs, refining and treatment charges (for both doré and concentrate products), sales costs, export taxes and operational stripping costs, but exclude depreciation and amortization (non-cash items). The sum of these costs is divided by the corresponding gold equivalent ounces sold to determine a per ounce amount.
All-in sustaining costs consist of cash costs (as described above), plus accretion of retirement obligations and amortization of the asset retirement costs related to operating sites, environmental rehabilitation costs for mines with no reserves, sustaining exploration and development costs, sustaining capital expenditures and sustaining lease payments. Our all-in sustaining costs exclude the allocation of corporate general and administrative costs. The following is additional information regarding our all-in sustaining costs:
- Sustaining operating costs represent expenditures incurred at current operations that are considered necessary to maintain current annual production at the mine site and include mine development costs and ongoing replacement of mine equipment and other capital facilities. Sustaining capital costs do not include costs of expanding the project that would result in improved productivity of the existing asset, increased existing capacity or extended useful life.
- Sustaining exploration and development costs include expenditures incurred to sustain current operations and to replace reserves and/or resources extracted as part of the ongoing production. Exploration activities performed near-mine (brownfield) or new exploration projects (greenfield) are classified as non-sustaining.
The sum of all-in sustaining costs is divided by the corresponding gold equivalent ounces sold to determine a per ounce amount.
Costs excluded from cash costs and all-in sustaining costs, in addition to depreciation and depletion, are income and mining tax expenses, all corporate financing charges, costs related to business combinations, asset acquisitions and asset disposal, and any items that are deducted for the purpose of normalizing items.
The following tables reconcile these non-GAAP measures to the most directly comparable GAAP measure, production costs applicable to sales:
| Three months ended March 31, 2026 | |||||||||||
| Gold Bar | Fox Complex | Total | |||||||||
| (in thousands, except per ounce) | |||||||||||
| Production costs applicable to sales | $ | 19,379 | $ | 14,711 | $ | 34,090 | |||||
| Less: costs of externally sourced material processed | — | (1,712 | ) | (1,712 | ) | ||||||
| Production costs applicable to sales (100% owned) | 19,379 | 12,999 | 32,378 | ||||||||
| In‑mine exploration | 84 | — | 84 | ||||||||
| Capitalized mine development (sustaining) | — | 4,274 | 4,274 | ||||||||
| Capital expenditures on plant and equipment (sustaining) | 1,846 | — | 1,846 | ||||||||
| Sustaining leases | — | 34 | 34 | ||||||||
| All‑in sustaining costs | $ | 21,309 | $ | 17,307 | $ | 38,616 | |||||
| Ounces sold, including stream (GEO) | 7,877 | 5,669 | 13,547 | ||||||||
| Less: ounces from externally sourced material processed (GEO) | — | (172 | ) | (172 | ) | ||||||
| Ounces sold from own production, including stream (GEO) | 7,877 | 5,497 | 13,375 | ||||||||
| Cash cost per ounce sold ($/GEO) | $ | 2,460 | $ | 2,365 | $ | 2,421 | |||||
| AISC per ounce sold ($/GEO) | $ | 2,705 | $ | 3,148 | $ | 2,887 | |||||
| Three months ended March 31, 2025 | |||||||||||
| Gold Bar | Fox Complex | Total | |||||||||
| (in thousands, except per ounce) | |||||||||||
| Production costs applicable to sales (100% owned) | $ | 9,094 | $ | 10,511 | $ | 19,605 | |||||
| In‑mine exploration | 67 | — | 67 | ||||||||
| Capitalized underground mine development (sustaining) | 7,597 | 2,338 | 9,935 | ||||||||
| Capital expenditures on plant and equipment (sustaining) | 665 | — | 665 | ||||||||
| Sustaining leases | 13 | (75 | ) | (62 | ) | ||||||
| All‑in sustaining costs | $ | 17,436 | $ | 12,774 | $ | 30,210 | |||||
| Ounces sold, including stream (GEO) | 7,935 | 5,101 | 13,036 | ||||||||
| Cash cost per ounce sold ($/GEO) | $ | 1,146 | $ | 2,061 | $ | 1,504 | |||||
| AISC per ounce sold ($/GEO) | $ | 2,197 | $ | 2,504 | $ | 2,318 | |||||
| Three months ended March 31, | ||||||||
| 2026 | 2025 | |||||||
| San José mine cash costs (100% basis) | (in thousands, except per ounce) | |||||||
| Production costs applicable to sales | $ | 77,871 | $ | 56,588 | ||||
| Site exploration expenses | 4,341 | 1,397 | ||||||
| Capitalized underground mine development (sustaining) | 5,751 | 8,761 | ||||||
| Less: Depreciation | (218 | ) | (694 | ) | ||||
| Capital expenditures (sustaining) | 1,294 | 920 | ||||||
| All‑in sustaining costs | $ | 89,039 | $ | 66,972 | ||||
| Ounces sold (GEO) | 32,933 | 21,977 | ||||||
| Cash cost per ounce sold ($/GEO) | $ | 2,365 | $ | 2,575 | ||||
| AISC per ounce sold ($/GEO) | $ | 2,704 | $ | 3,047 | ||||
The following tables present a reconciliation of adjusted EBITDA:
| Three months ended March 31, | |||||||
| 2026 | 2025 | ||||||
| (in thousands) | |||||||
| Net income (loss) before income and mining taxes | $ | 33,205 | $ | (7,349 | ) | ||
| Less: | |||||||
| Depreciation and depletion | 7,077 | 6,171 | |||||
| Loss from investment in Paragon Advanced Labs Inc. (Note 9) | 340 | — | |||||
| Loss from investment in McEwen Copper Inc. (Note 9) | 2,074 | 8,578 | |||||
| Interest expense | 2,124 | 1,309 | |||||
| Adjusted EBITDA | $ | 44,819 | $ | 8,709 | |||
| Weighted average shares outstanding (thousands) | 59,112 | 53,270 | |||||
| Adjusted EBITDA per share | $ | 0.76 | $ | 0.16 | |||
Technical Information
The technical content of this news release related to financial results, mining, reserves and development projects has been reviewed and approved by William (Bill) Shaver, P.Eng., COO of McEwen Inc. and a Qualified Person as defined by SEC S-K 1300 and the Canadian Securities Administrators National Instrument 43-101 "Standards of Disclosure for Mineral Projects."
Technical information pertaining to Gold Bar Mine Complex exploration contained in this news release has been prepared under the supervision of Robert Kastelic, CPG, McEwen Nevada’s Exploration Manager, who is a Qualified Person as defined by SEC S-K 1300 and Canadian Securities Administrators National Instrument 43-101 "Standards of Disclosure for Mineral Projects."
Technical information pertaining to the Fox Complex exploration contained in this news release has been prepared under the supervision of Sean Farrell, P.Geo., McEwen Ontario’s Exploration Manager, who is a Qualified Person as defined by SEC S-K 1300 and Canadian Securities Administrators National Instrument 43-101 "Standards of Disclosure for Mineral Projects."
Technical information pertaining to resource estimates and the Tartan Mine Project exploration contained in this news release has been prepared under the supervision of Luke Willis, P.Geo., McEwen’s Director of Resource Modelling, who is a Qualified Person as defined by SEC S-K 1300 and Canadian Securities Administrators National Instrument 43-101 "Standards of Disclosure for Mineral Projects."
Analyses reported herein were submitted either as half core or reverse circulation (RC) chip samples and assayed by the photon assay method either at the accredited laboratories of MSA Labs (ISO 9001 & ISO 17025) in Timmins, Ontario or Paragon Geochemical (ISO 17025), in either Hamilton (Ontario), Reno (Nevada) or Vancouver (British Columbia). As part of our regular QA/QC program McEwen Inc. follows a closely controlled and documented Chain of Custody protocol and submits certified reference materials and blanks in the sample stream for the monitoring and assessment of laboratory processes and procedures. All incoming QA/QC results are reviewed to ensure data quality before incorporating the information into the geological database.
Reliability of Information Regarding San José
The Company accounts for its investment in Minera Santa Cruz S.A., the owner of the San José Mine, using the equity method. The Company relies on the management of MSC to provide accurate financial information prepared in accordance with GAAP. While the Company is not aware of any errors or possible misstatements of the financial information provided by MSC, MSC is responsible for and has supplied to the Company all reported results from the San José Mine, and such results are unaudited as of the date of this release. McEwen’s joint venture partner, a subsidiary of Hochschild Mining plc, and its affiliates other than MSC do not accept responsibility for the use of project data or the adequacy or accuracy of this release.
ABOUT MCEWEN
McEwen shares trade on both the NYSE and TSX under the ticker MUX.
McEwen provides its shareholders with exposure to a growing base of gold and silver production in addition to a very large copper development project, all in the Americas. The gold and silver mines are in prolific mineral-rich regions of the world: the Cortez Trend in Nevada, USA, the Timmins district of Ontario and Flin Flon in Manitoba, Canada, and the Deseado Massif in Santa Cruz province, Argentina. McEwen is also reactivating its gold and silver El Gallo Mine in Mexico.
The Company has a 46.3% interest in McEwen Copper, which owns the large, long-life, advanced-stage Los Azules copper development project in San Juan province, Argentina – a region that hosts some of the country’s largest copper deposits. According to the last financing for McEwen Copper, the implied value of McEwen’s ownership interest is US$456 million.
The Los Azules copper project is designed to be one of the world’s first regenerative copper mines and carbon neutral by 2038. Its Feasibility Study results were announced in the press release dated October 7, 2025.
McEwen also recently purchased 27.3% of Paragon Advanced Labs Inc., a newly listed public company that is deploying PhotonAssay™ units around the world, a technology that the Company believes is poised to become the new industry standard for assaying precious and base metals, with Paragon aiming to be one of the leading service providers.
Chairman and Chief Owner Rob McEwen has invested over US$250 million personally and takes a salary of $1 per year, aligning his interests with shareholders. He is a recipient of the Order of Canada, a member of the Canadian Mining Hall of Fame and a winner of the EY Entrepreneur of the Year (Energy) award. His objective is to build MUX’s profitability, share value, and ultimately implement a dividend policy, as he did while building Goldcorp Inc.
CAUTION CONCERNING FORWARD-LOOKING STATEMENTS
This news release contains certain forward-looking statements and information, including "forward-looking statements" within the meaning of the Private Securities Litigation Reform Act of 1995. The forward-looking statements and information expressed, are as at the date of this news release and are McEwen Inc.'s (the "Company") estimates, forecasts, projections, expectations or beliefs as to future events and results. Forward-looking statements and information are necessarily based upon a number of estimates and assumptions that, while considered reasonable by management, are inherently subject to significant business, economic and competitive uncertainties, risks and contingencies, and there can be no assurance that such statements and information will prove to be accurate. Therefore, actual results and future events could differ materially from those anticipated in such statements and information. Risks and uncertainties that could cause results or future events to differ materially from current expectations expressed or implied by the forward-looking statements and information include, but are not limited to, fluctuations in the market price of precious metals, mining industry risks, political, economic, social and security risks associated with foreign operations, the ability of the Company to receive or receive in a timely manner permits or other approvals required in connection with operations, risks associated with the construction of mining operations and commencement of production and the projected costs thereof, risks related to litigation, the state of the capital markets, environmental risks and hazards, uncertainty as to calculation of mineral resources and reserves, foreign exchange volatility, foreign exchange controls, foreign currency risk, and other risks. Readers should not place undue reliance on forward-looking statements or information included herein, which speak only as of the date hereof. The Company undertakes no obligation to reissue or update forward-looking statements or information as a result of new information or events after the date hereof except as may be required by law. See McEwen Inc.'s Annual Report on Form 10-K for the fiscal year ended December 31, 2025, and other filings with the Securities and Exchange Commission, under the caption "Risk Factors", for additional information on risks, uncertainties and other factors relating to the forward-looking statements and information regarding the Company. All forward-looking statements and information made in this news release are qualified by this cautionary statement.
The NYSE and TSX have not reviewed and do not accept responsibility for the adequacy or accuracy of the contents of this news release, which has been prepared by the management of McEwen.
Want News Fast?
Subscribe to our email list by clicking here:
https://www.mcewenmining.com/contact-us/#section=followUs
and receive news as it happens!!
| WEB SITE | SOCIAL MEDIA | |||||
| www.mcewenmining.com |
McEwen |
Facebook: | facebook.com/mceweninc | |||
| LinkedIn: | linkedin.com/company/mceweninc | |||||
| CONTACT INFORMATION | X: | X.com/mceweninc | ||||
| 150 King Street West | Instagram: | instagram.com/mceweninc | ||||
| Suite 2800, PO Box 24 | ||||||
| Toronto, ON, Canada |
McEwen Copper |
Facebook: | facebook.com/ mcewencopper | |||
| M5H 1J9 | LinkedIn: | linkedin.com/company/mcewencopper | ||||
| X: | X.com/mcewencopper | |||||
| Relationship with Investors: | Instagram: | instagram.com/mcewencopper | ||||
| (866)-441-0690 - Toll free line | ||||||
| (647)-258-0395 |
Rob McEwen |
Facebook: | facebook.com/mcewenrob | |||
| Mihaela Iancu ext. 2006 | LinkedIn: | linkedin.com/in/robert-mcewen-646ab24 | ||||
| info@mcewenmining.com | X: | X.com/robmcewenmux | ||||
Photos accompanying this announcement are available at:
https://www.globenewswire.com/NewsRoom/AttachmentNg/ebaf36e4-52f2-44b4-bfc1-491cd9f26245
https://www.globenewswire.com/NewsRoom/AttachmentNg/74d0f0fa-96df-47c8-9f35-22bef9256655
https://www.globenewswire.com/NewsRoom/AttachmentNg/359082fb-ba26-454b-8e01-86f79eb9e01a
https://www.globenewswire.com/NewsRoom/AttachmentNg/f28ad692-4813-4cfb-a8bb-94ad486d05a1
https://www.globenewswire.com/NewsRoom/AttachmentNg/152391bc-5f1b-4bf7-99da-97bcbb7a2810
https://www.globenewswire.com/NewsRoom/AttachmentNg/297aaa2c-41e3-403b-aaf8-1a58fb7cccff

![]()
Fig. 1. Plan View of Recent Windfall Drilling

Fig. 1. Plan View of Recent Windfall Drilling
Fig. 2. Windfall Cross Section High-grade Results in Drillhole WF181
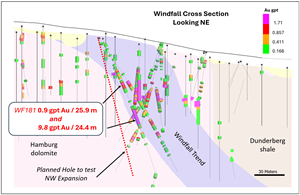
Fig. 2. Windfall Cross Section High-grade Results in Drillhole WF181
Fig. 3. Gibson and Whiskey Jack Plan View Map

Fig. 3. Gibson and Whiskey Jack Plan View Map
Fig. 4. Whiskey Jack Cross Section
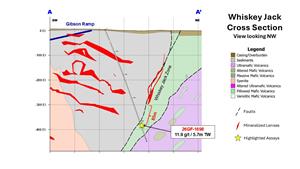
Fig. 4. Whiskey Jack Cross Section
Fig. 5. Stroud Location and Plan View Map
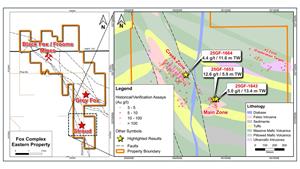
Fig. 5. Stroud Location and Plan View Map
Fig. 6. Long Section of Tartan’s Main Zone – Selected Drill Highlights
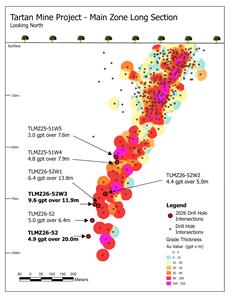
Fig. 6. Long Section of Tartan’s Main Zone – Selected Drill Highlights
Legal Disclaimer:
EIN Presswire provides this news content "as is" without warranty of any kind. We do not accept any responsibility or liability for the accuracy, content, images, videos, licenses, completeness, legality, or reliability of the information contained in this article. If you have any complaints or copyright issues related to this article, kindly contact the author above.
